I follow extremes events in the cryosphere, tracing water from the ocean to snowfall and surface melt on ice sheets.
I’m motivated by the impacts of climate change on people
I am an Assistant Professor of Digital Twins within the Geoscience and Remote Sensing Department at the Delft University of Technology.
Scroll down for selected works using variable-resolution Earth Systems Models, regional climate models and satellite-based remote sensing. See Publications and Roles for more complete information and please feel free to Contact me by email.
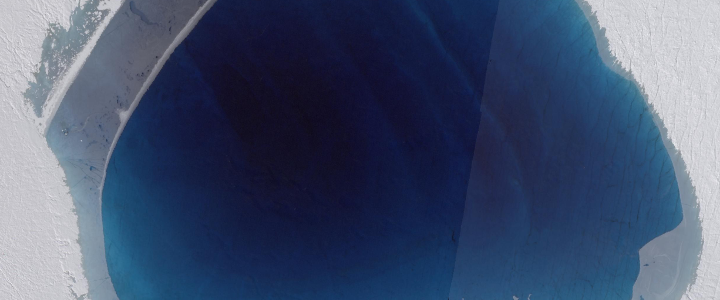
*image from Planet SkySat
The Surface of Ice Sheets

The Antarctic and Greenland ice sheets hold 2/3 of the earth’s fresh water in the form of ice (*1), the majority of which is grounded to land and flows outward towards the ocean . While most of the Greenland ice sheet terminates on land, the Antarctic ice sheet flows over the ocean into floating ice shelves.
The mass balance of ice held on the Antarctic and Greenland ice sheets is the budget between the surface mass balance (SMB) and discharge of ice at the margins (e.g. through calving). SMB is the budget between gain by precipitation, condensation and deposition and the loss from runoff (surface melt not retained by the ice sheet), with wind erosion largely redistributing snow (*2)
(*for external references, scroll to bottom)
Antarctica: Getting Weirder
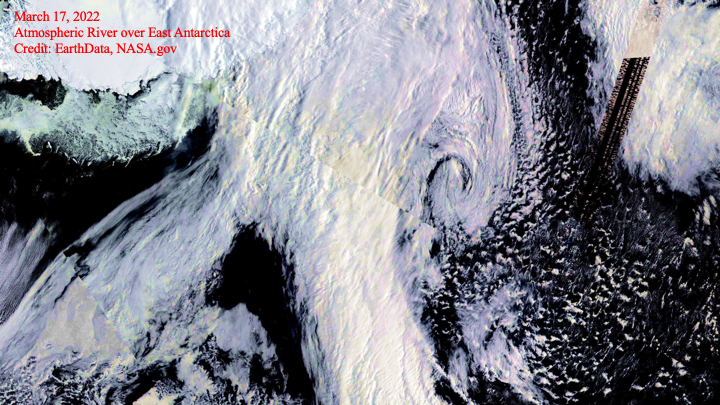
Over the last few years, Antarctica has witnessed major changes (in the context of the modern era), including rapidly-declining sea ice since 2016, reaching new record lows for sea ice this year (courtesy of Zack Labe ), a record high surface mass balance in 2022 (1) and a highly-anomalous heatwave in March of 2022 (producing record snowfall) which was coincident with an atmospheric river (1). In 2022, the planet also reached record high concentrations of greenhouse gases and ocean heat content.
CU Boulder covers the release of the BAMS “State of the Climate” here
(see Publications for full reference)
Resolving Snowfall

Snowfall is the major component of Antarctic SMB, and we can capture its variability using both Regional Climate Models (RCMs) and Earth Systems Models (ESMs):
RCMs of the atmosphere and land/ice surface, such as the RCM Modèle Atmosphérique Regionale (MAR) run at a high spatial resolution over a region, such as the Antarctic Peninsula (2), forced at the boundaries by reanalysis or other models.
ESMs contain multiple earth systems components simulating the entire earth (e.g. ice sheets, oceans sea ice, land models and the biosphere), but are typically run at very coarse spatial resolutions.
One way to balance the power of ESMs with the resolution of RCMs is a variable-resolution ESM, (e,g VR-CESM2) which enhances resolution over a region, for example: over Antarctica and the Southern Ocean (3).
Linking it Up
Oceans, Sea Ice and Snowfall
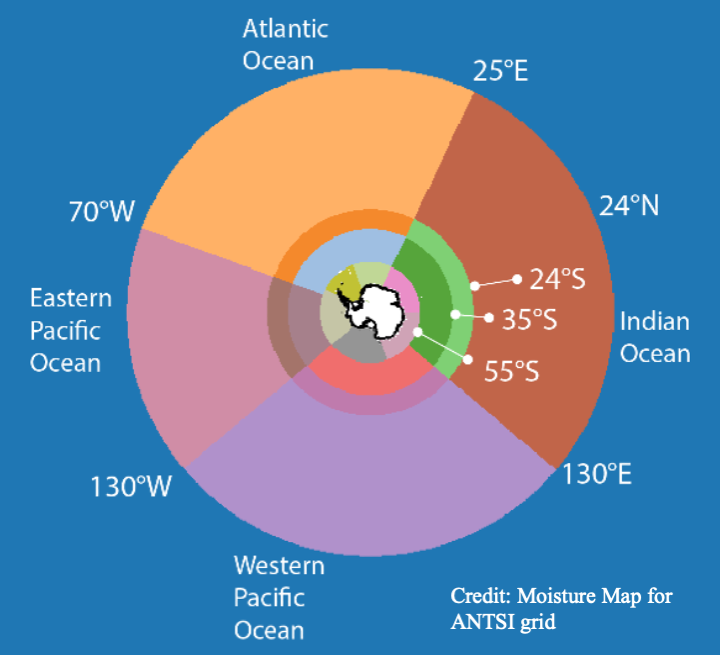
Although the majority of the snow falling on Antarctica comes from the Southern Ocean(*3), atmospheric rivers can transport moisture to Antarctica from as far as the tropics. Changing conditions in oceans and sea ice can alter the dynamics of where moisture comes from, where it lands, and how intense extreme events are.
My current work uses a variable-resolution ESM (VR-CESM2) with the ability to tag precipitation falling on an ice sheet to where it entered the atmosphere over the ocean (anywhere on earth). This setup can help capture and quantify how links between the ocean, sea ice and the ice sheet have changed over time. The same setup is also used to design an experiment to attribute how recent sea ice loss (and associated ocean warming) could change snowfall over Antarctica, especially during extreme events like atmospheric rivers.
This is work in-progress.
Firn
The Thin Line
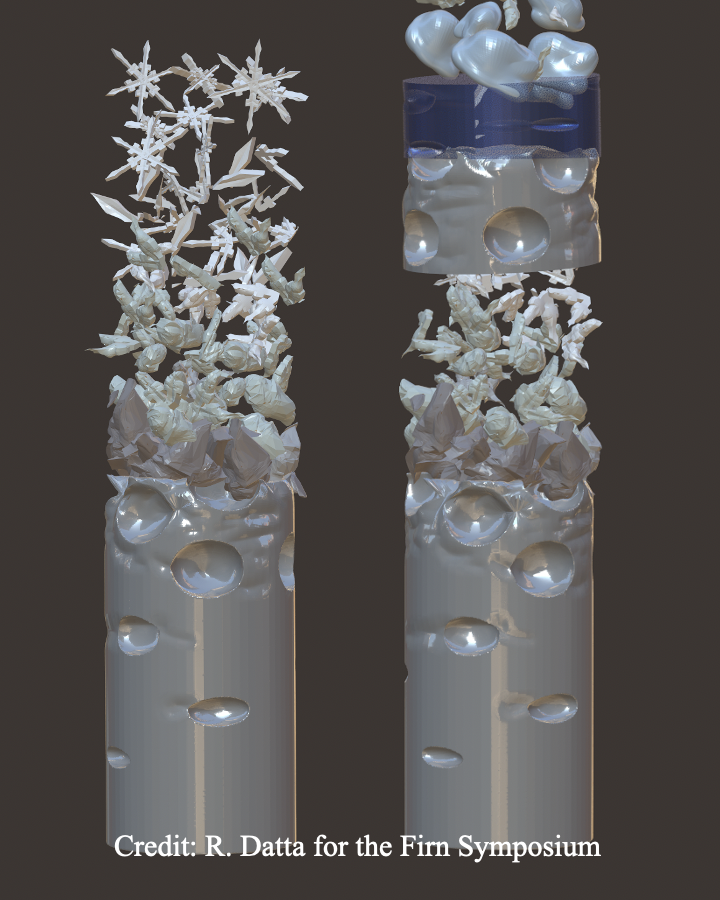
Fresh snow accumulates at the surface of an ice sheet and forms multi-year firn, which then compresses into glacial ice. Meltwater, wind, snowfall, rain, and heat can change whether firn forms features like ice layers and pockets of meltwater, or melts and runs off into the ocean to lead to greater sea level rise. Firn can change dramatically even as a result of brief (but extreme) events. This thin layer acts a buffer between a changing climate and ice sheets.
The scientific importance of firn propelled the first International Firn Symposium (for which I was a coordinator) and a resulting paper, currently in review (which I have co-led) (4).
This work is large-scale collaborative science in action.
Foehn Winds & Surface Melt
On the Larsen C Ice Shelf
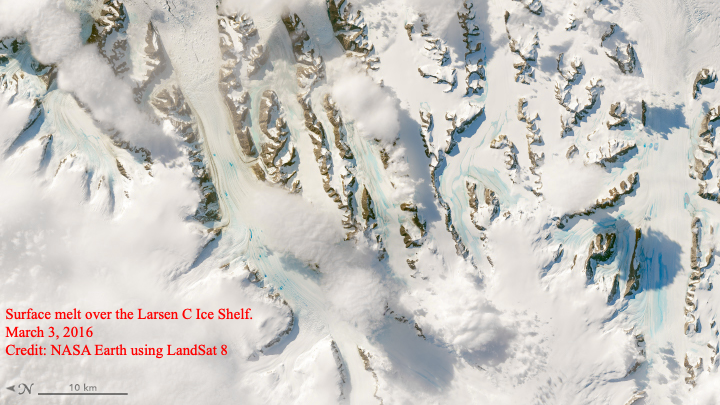
Surface melt can accumulate in firn, filling pockets of air, refreeze, and increase firn density. On ice shelves this can lead to greater ice shelf vulnerability and potentially even collapse through a process called “hydrofracture”(*4)
The Larsen C ice shelf, on the eastern side of the Antarctic Peninsula, is vulnerable partially due to hot, dry foehn winds, which can generate intense surface melt.
My work quantified foehn-induced melt over the Larsen C ice shelf and used pattern analysis on satellite data and RCM outputs to discover/quantify impacts of a highly-anomalous winter foehn-induced surface melt event in 2016 (5)
Lakes on Greenland
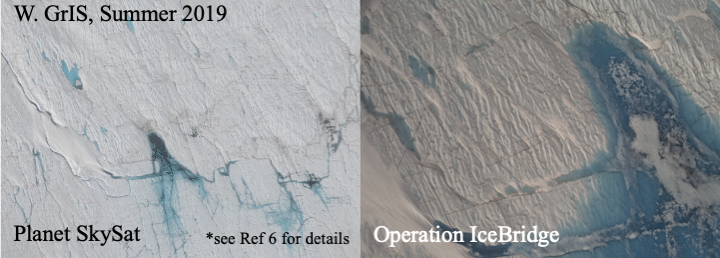
The summer of 2019 was an anomalously high-melt year over the Greenland Ice Sheet (GrIS), producing surface lakes over much of the melt season.
We quantify the water actually held in these lakes using satellites, developing an original lake depth algorithm (“Watta”) using the satellite laser altimeter ICESat-2 and extended these depths to total lake volumes using high-resolution Planet Imagery (6). This work produced a stacked dataset of repeated high-resolution imagery taken along both ICESat-2 tracks (satellite) and parts of the airborne NASA Operation IceBridge mission. High-resolution (~1m) Planet imagery was tasked repeatedly over swaths of the GrIS over much of the summer.
This work is covered by Planet Labs Here
I conducted this work as a PI within the experimental NASA Small Satellite Databuy Program
When firn is sufficiently dense, it can support lakes over the ice shelves of Antarctica as well as over wide swaths of the grounded Greenland Ice Sheet (GrIS).
On the Ground, In the Air
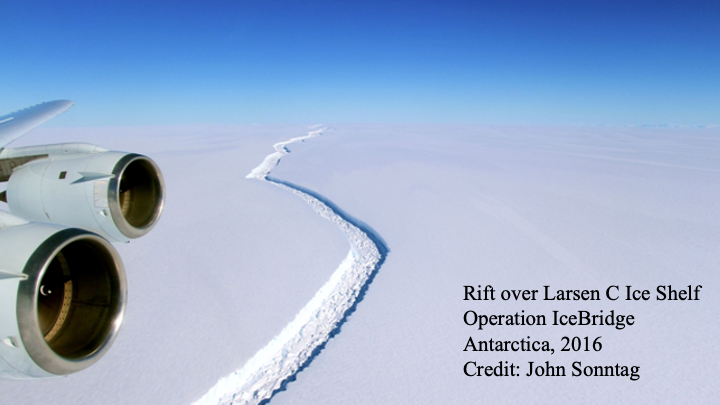
Airborne and ground measurements provide the most detailed picture of what’s happening on the surface. I had the opportunity to fly over Antarctica for two seasons (2016 and 2017) of the airborne NASA Operation IceBridge mission and to participate in ground campaigns in both Grand Mesa, CO and Fairbanks, Alaska as a part of the NASA SnowEx mission.
In addition to my expertise in Polar regions, I think about the human impacts of climate change and how to quantify that in ways that the public can use. More coming soon.
References
1. Church, J. A., Clark, P. U., Cazenave, A., Gregory, J. M., Jevrejeva, S., Levermann, A., et al.. Sea level change. In T. F. Stocker, et al. (Eds.). Climate Change 2013: The Physical Science Basis. Contribution of Working Group I to the Fifth Assessment Report of the Intergovernmental Panel on Climate Change. Cambridge University Press. (2013)
2. Lenaerts, J. T. M., Medley, B., van den Broeke, M. R. & Wouters, B. Observing and Modeling Ice Sheet Surface Mass Balance. Rev. Geophys. 57, 376–420 (2019).
3. Wang, H., Fyke, J. G., Lenaerts, J. T. M., Nusbaumer, J. M., Singh, H., Noone, D., Rasch, P. J., & Zhang, R. Influence of sea-ice anomalies on Antarctic precipitation using source attribution in the Community Earth System Model. The Cryosphere, 16. (2020)
4. Scambos, T. A., Hulbe, C., Fahnestock, M. & Bohlander, J. The link between climate warming and break-up of ice shelves in the Antarctic Peninsula. J. Glaciol. 46, 516–530 (2000).